Student Screen Use
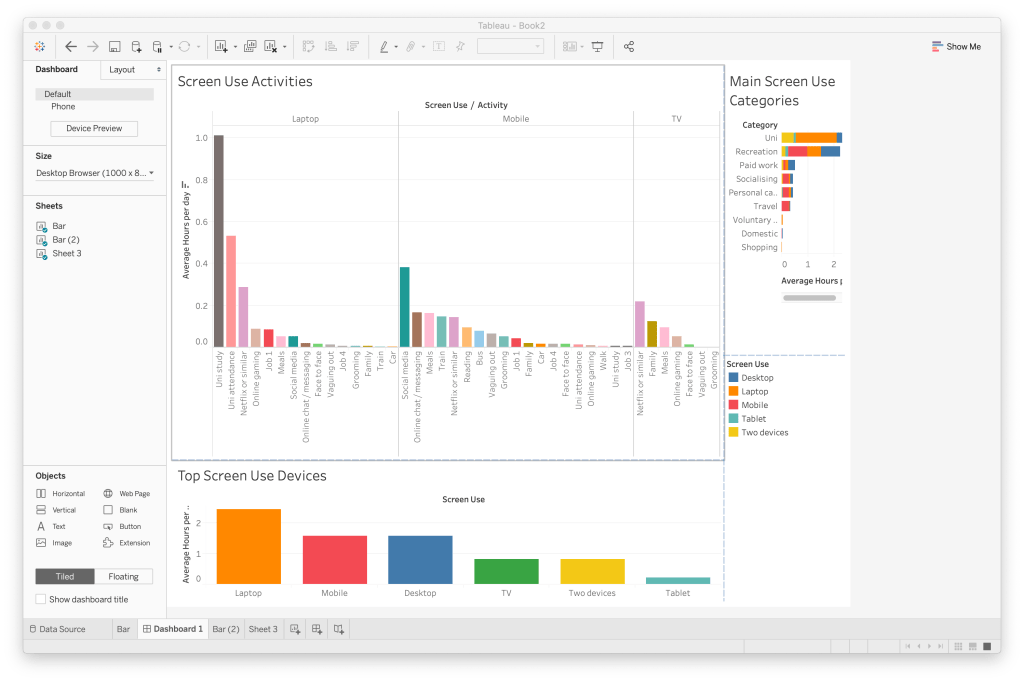
The following dashboard shows how students use their time including screen use. The chart below shows the most used screen devices and the hours per day. I also included the category which used the most amount of screen time which was university and recreation. The middle graph shows the types of activities that were used by which screen, i limited the activities to 3 devices – Laptop, Mobile and TV.