We visualise data to gain insight to understand a complex issues. Creating a visual tool (data visualisation) to simplify hard to read data.
The Functional Art – Alberto Cairo
Comparison between reading data in numbers to visualising in graph form. When trying to find a certain comparison in data, its to memorise numbers and compare this way.
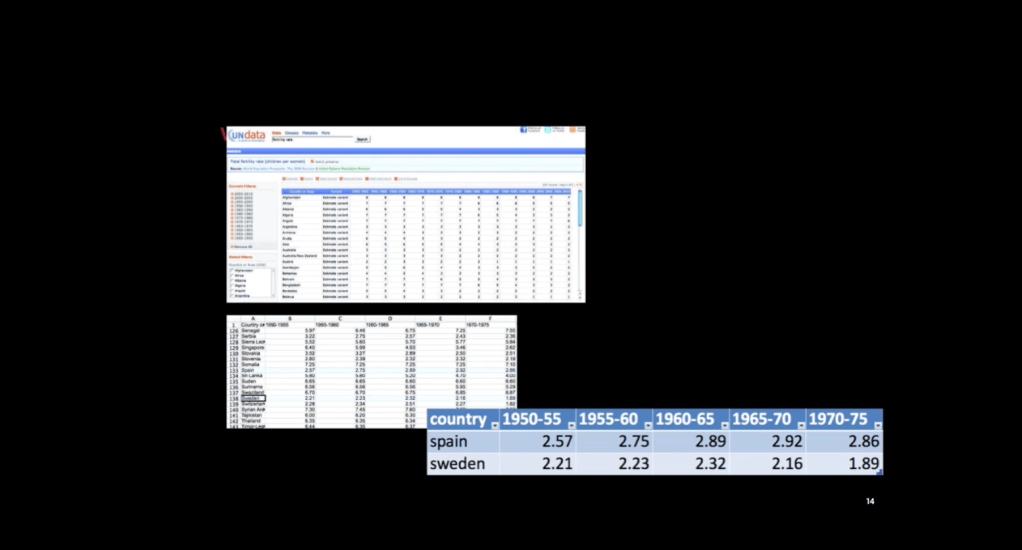
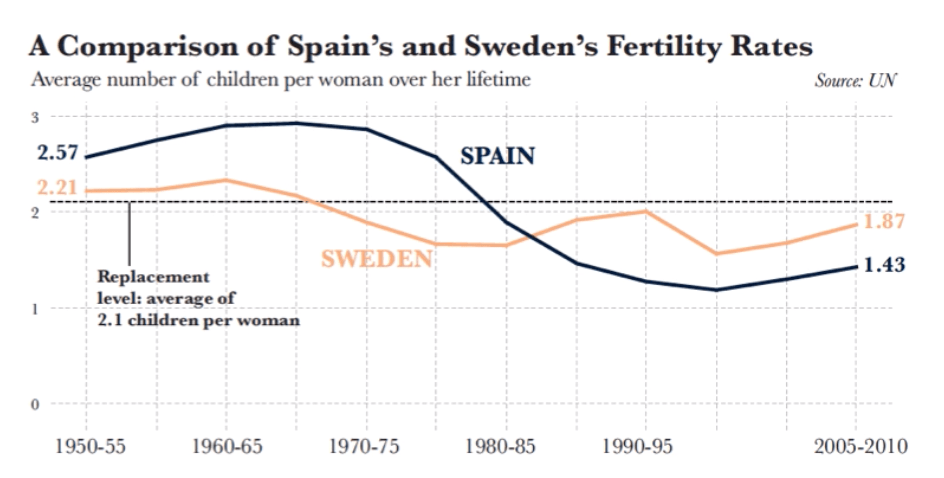
The example is a contemporary data visualisation which gives us the tool to see the whole story and make comparisons of the data.
‘Functional art, that is beautiful and engaging as well as honouring the intelligence and curiosity of your readers’
