Basic Data Types
Collecting and wrangling data helps to find the right visualisation for your needs. There are 4 basic levels of measurement – nominal, ordinal, interval and ratio
Nominal – Named categories of which the data is formed (unordered) Super market example. Used to calculate percentage of eg. Canned, frozen, produce, dairy…
Ordinal – Numbers in order, no category has any mathematical data. Any set of ordered number to represent group – numbers interpret end analysis.
Interval – Time of day falls into interval data. Numeric data – eg. 0am isn’t the absence of time but the start of a new day.
Ratio – Time compared, eg. 0 represents absence, nothing of that type
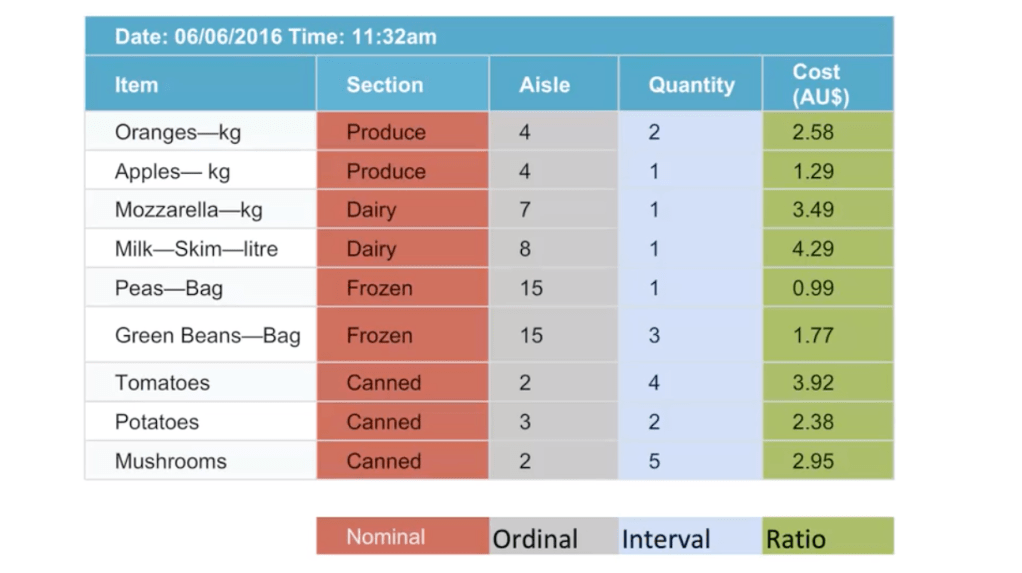
The following is the data types explained in the supermarket example.
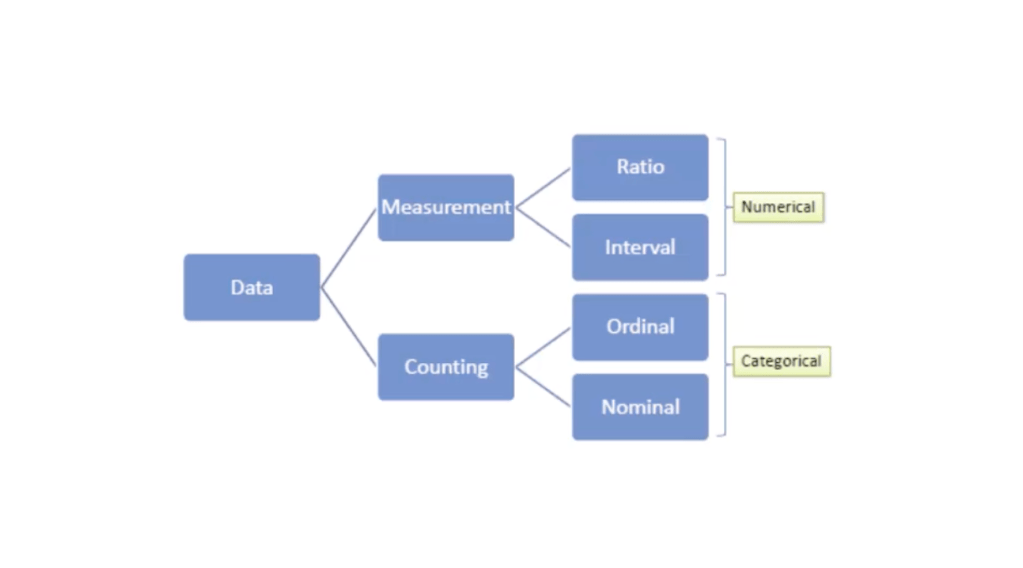
Chart divided into 2 sections, numerical & categorical – useful to define types of data. Naming variables helps to avoid mistakes when reading data.
