Our Time Data Exploration
Make a Story
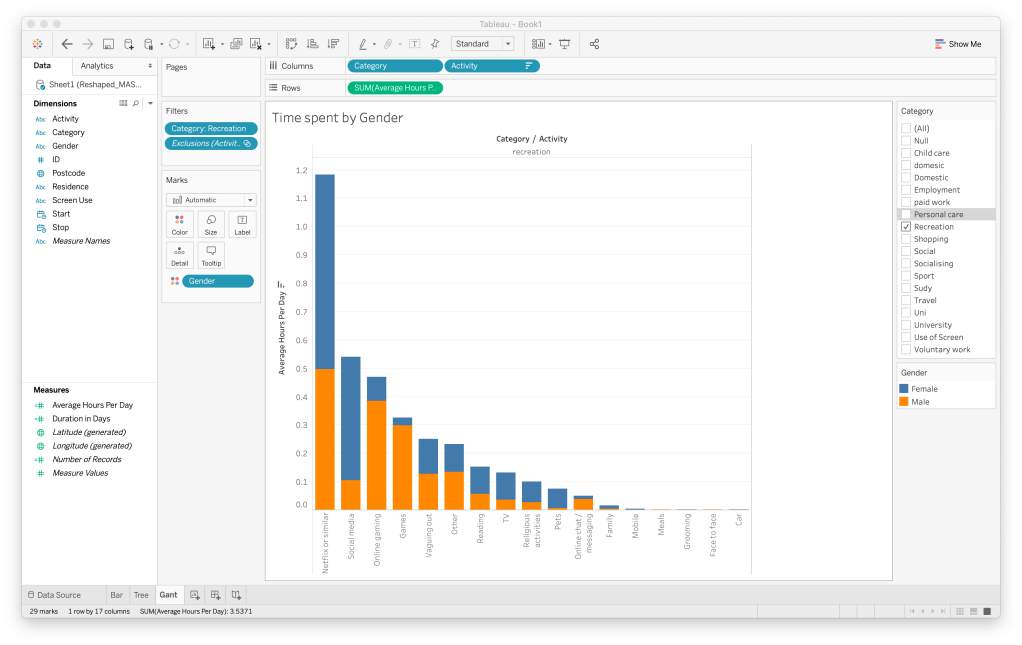
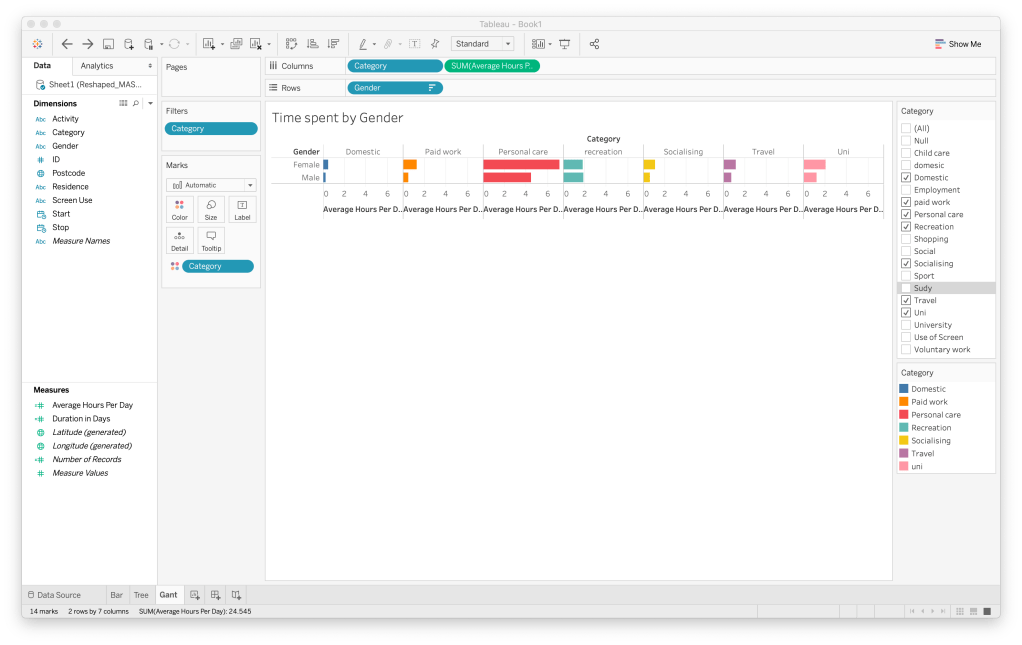
Gender Time Use
From the gannt chart shown above, females spend more time on personal care than men but the same amount on recreation. Even though there may be more females in the data, the results show how they use they use their time. It’s interesting to see that the recreation results for both genders are similar. By looking further into the recreation category, you can see that men are spending more time on video games while women spend double the amount on social media.